FUEL EFFICIENCY
Improving Your Mileage
|
||||||||||||||||||||||||||||||||||||
|
Measuring Your Efforts |
||||||||||||||||||||||||||||||||||||
| Measure Your Efforts at Fuel Efficiency | ||||||||||||||||||||||||||||||||||||
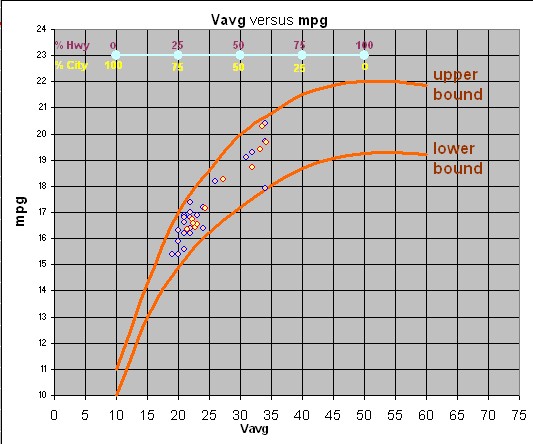
In the graph to the right are plotted the average miles per gallon (mpg) for each tank of fuel used against the average speed for the driving time between re-fueling. That particular chart is for my pickup truck. You might notice that most of my driving is on city streets, with attendant poor mileage due to operating in the lower gears, and idling at traffic lights. I don't get up in the better mileage range until I get up on the highways or freeways. If you have these performance parameters, it is wise to record them at every fueling, and plot them as I have done. This type of information is often directly available for those vehicles that have on-board computers, usually included in higher-end models, but also available as after-market add-on devices. If you have the option of installing an on-board computer, it is a worthwhile option -- it gives you feedback on how effective you are at being efficient. Even if you don't have an on-board computer, you should at least record your mileage at every fuel-up -- easily calculated from the difference in your odometer readings for your current and prior fuel-ups, and the gas pump reading. Average speed is a little trickier without an on-board computer. You have to record how long your engine is running between fuel-ups. Every minute counts, even just sitting and idling. The calculation of average speed is simple if you have the engine-on time -- you just divide the miles driven by the hours the engine was running. Most on-board computers do that for you automatically. Some folks (without an on-board computer) estimate the percentage city versus highway driving. At the top of the graph is an estimate of those percentages. But that is just a guess -- not accurate enough to reveal trends or evaluate performance. |
|
|||||||||||||||||||||||||||||||||||
| You might notice in the chart that fuel efficiency (mpg) increases as average speed (Vavg) increases. Situations that decrease your average speed are idling at traffic lights, city street speed limits, lots of turning traffic, and so forth. Situations that decrease you mileage are: jack-rabbit starts, a lead foot on the accelerator, going up hills (and having to downshift), driving into a headwind, using adulterated fuel (Ethanolated fuels), high outside air temperatures, high altitudes, and high humidity. Some of these things you can control, and some you can't. That is why, in the graph we have estimated an upper and lower bounds -- a performance range within which your vehicle will operate -- even if you follow most efficient practices. For example, notice in the graph above that between 30 and 35 mph average speed, fuel efficiency ranges between 18- and 20+ mpg -- which is a 10% variance. The upper bound on the graph can be estimated from your vehicle's official EPA estimated mileages -- highway and city. The EPA estimated highway mileage occurs at about 55 mph average speed, and is calculated assuming the most optimistic driving conditions. It is usually the most efficient mileage you could ever expect. The EPA estimated city mileage occurs at about 20 mph average speed, and is also calculated assuming the most optimistic driving conditions. The lower bound is an educated guess. You know your actual performance is going to be less than optimal, but you don't have a ready means to sense or measure sub-optimal conditions. What it boils down to, for improving fuel efficiency, is to take measures to increase you average speed by staying in the highest gear you can (without lugging the engine), and avoid those situations that waste fuel (such as engine idling at a stop light), and keep a light foot on the accelerator. And if you have a choice between a freeway and a city street -- choose the freeway (unless it has become a temporary parking lot.) |
||||||||||||||||||||||||||||||||||||
© 2014, Simon R. Mouer III, PhD, PE
All rights reserved.